
Revenue Tracking for Home Care Agencies: The Metrics That Actually Tell You If Your Agency Is Healthy
Author
Fornex Health Team
Published
July 12, 2026
An agency owner reviewed her monthly billing report along with noticed something she could not explain: claim volume was up 12% but collected revenue had barely moved. The visits were happening. The claims were going out. The money was not coming in at the rate it should.
That gap between activity along with revenue is visible in the aggregate but invisible without the right metrics to trace its source. More visits does not automatically mean more revenue in home care. More visits with clean EVV along with confirmed authorizations along with signed documentation along with zero denials means more revenue. The difference between those two things is what revenue tracking is designed to surface.
The Five Metrics That Actually Tell You Something
Clean claim rate is the percentage of claims accepted by the payer on first submission. It is the single most diagnostic metric in home care revenue tracking because it reflects the combined quality of every upstream process. A clean claim rate below 90% means something is consistently failing somewhere between intake along with submission. Finding where requires breaking the denial pattern down by reason code along with payer.
Days in accounts receivable measures how long it takes from claim submission to payment receipt. The home care benchmark is under 30 days. Above 50 days suggests either a payer-side processing issue along with a systemic problem with claim quality that is creating a corrections backlog. These are different problems with different fixes.
Denial rate by payer is the metric that reveals relationship-specific problems. If your Medicaid MCO denials run at 15% while your Medicare denials run at 6%, the problem is specific to that payer's rules along with your configuration against them. A single blanket denial rate across all payers obscures this pattern.
Authorization utilization rate tracks how closely delivered services match authorized services. A utilization rate consistently below 80% suggests services are being authorized at a higher level than the care plan requires, along with authorization resources are being committed without return. A rate above 100% means services are being delivered without authorization, which is a billing along with compliance problem simultaneously.
Cost per visit is the metric that connects billing performance to operational economics. It tracks total operational cost divided by delivered visit volume. Rising cost per visit alongside flat revenue per visit is a margin compression signal that requires an operational response, not just a billing one.
The Revenue Leakage Waterfall
Revenue leakage in home care does not happen in one place. It happens at every stage of the revenue cycle along with the losses compound.
An agency losing 3% to eligibility errors at intake, 4% to authorization issues, 5% to EVV denials along with 3% to unsigned documentation is not losing 15% of its revenue from one fixable problem. It is losing 15% from four separate process failures, each of which requires a different fix along with each of which is invisible without stage-specific metrics.
Building the revenue leakage waterfall for your agency — mapping exactly how much revenue is lost at each stage — is the most valuable financial analysis a home care agency can run. It is also the analysis that most agencies do not have the data infrastructure to produce without building it deliberately.
What a Revenue Dashboard Should Show
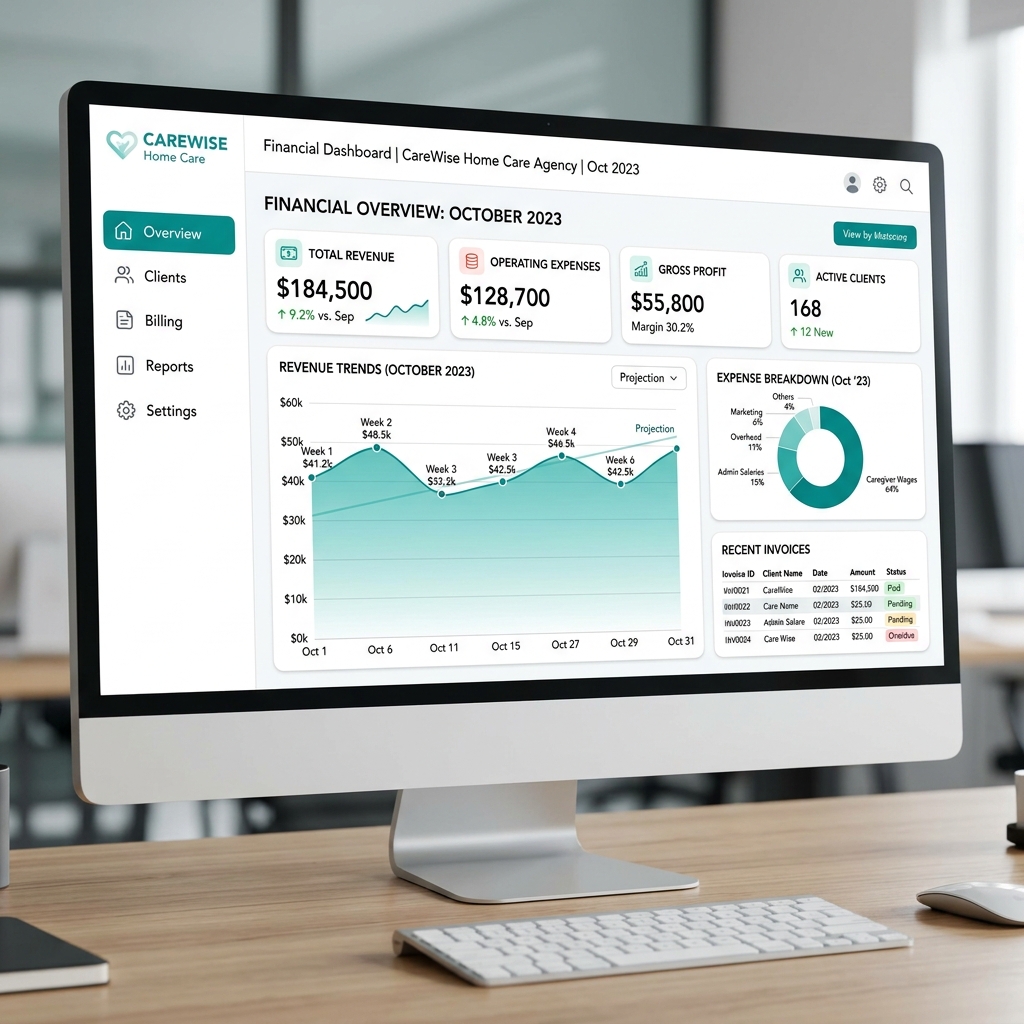
A functional home care revenue dashboard shows: real-time accounts receivable by payer, this week's clean claim rate versus the prior four-week average, current denial rate by denial reason code, authorization utilization by client along with service type along with days outstanding by payer.
These are not metrics you review monthly. They are metrics that require weekly review to be actionable. A denial pattern that is caught in week two along with investigated in week three along with corrected in week four loses one week of recurring denials. The same pattern caught monthly loses four weeks.
For the complete revenue cycle management framework that ties all of these metrics to their upstream causes, read: Healthcare Revenue Cycle Management: The Complete Guide
If your agency is ready to build the reporting infrastructure that gives you real visibility into where revenue is being lost, our Medical Billing along with Revenue Cycle Management team designs reporting systems built specifically for home care revenue cycle management.
Frequently Asked Questions
What metrics should home care agencies track for revenue?
Core home care revenue metrics are clean claim rate, days in accounts receivable, denial rate by payer, authorization utilization rate along with cost per visit. These five metrics together give a complete picture of revenue cycle health across intake, delivery along with billing.
What is a good clean claim rate for home care?
A clean claim rate above 95% is best-in-class for home care agencies. Most well-run agencies target 95% or higher. Below 90% indicates a systemic process failure that is generating preventable denials along with requiring staff rework.
What is days in AR for home care?
Days in AR (accounts receivable) measures the average time between claim submission along with payment receipt. The home care benchmark is under 30 days. Above 50 days indicates either payer-side processing delays along with a systemic claim quality problem creating a corrections backlog.
How do home care agencies calculate cost per visit?
Cost per visit is calculated by dividing total operational costs for a period by the number of visits delivered in that period. It includes direct caregiver labor, coordinator labor, administrative overhead along with technology costs. Tracking cost per visit alongside revenue per visit gives a real-time picture of margin by service type along with payer.
What is authorization utilization rate in home care?
Authorization utilization rate is the percentage of authorized service units that are actually delivered. A rate below 80% suggests over-authorization relative to the care plan. A rate above 100% means services are being delivered without authorization coverage, which creates denial along with compliance exposure.
Ready to Build for the Future?
Don't let legacy architecture limit your potential. Connect with us to build a flexible, AI-ready healthcare application.
Talk to Our Experts